The 3D scene shows the typical new US home for each year as you scroll, drawn from Census Bureau figures: floor area and lot to scale, the share of two-story homes, garage size, the most common foundation and exterior wall, and one small house for every 10,000 new homes completed. All of these numbers are also in the text, the charts and the data download below.
Average House Size by Year: How the New American Home Changed Since 1973
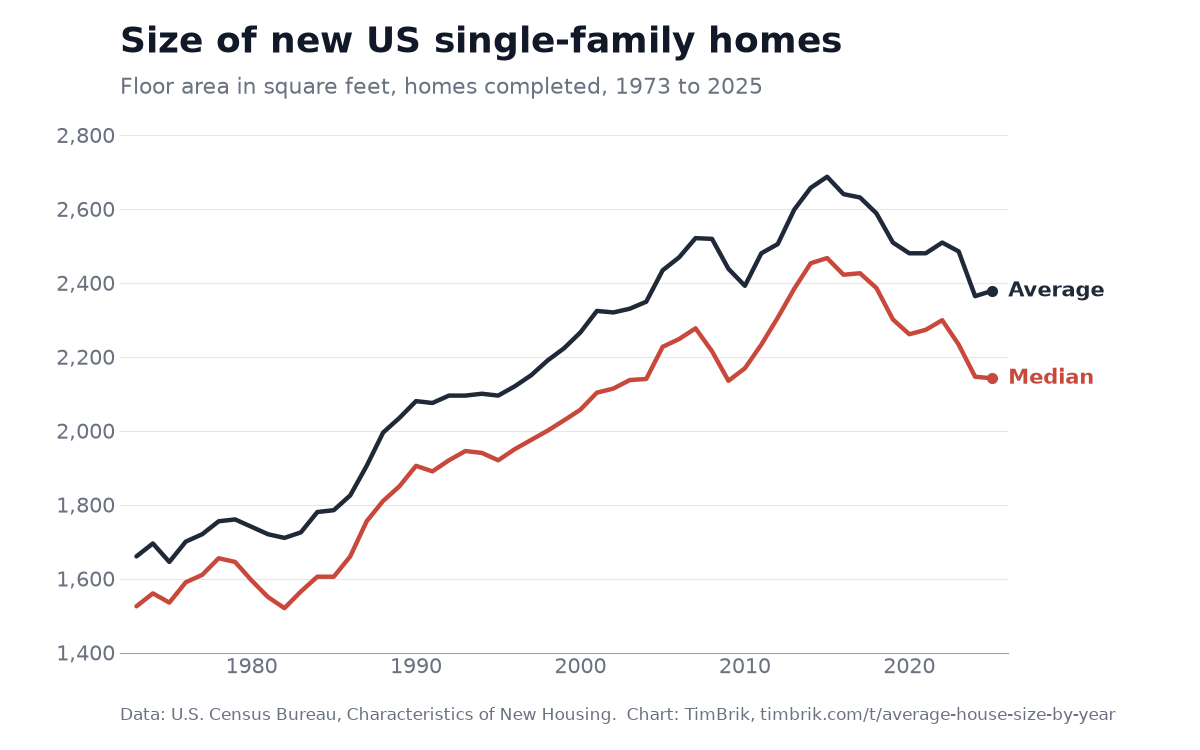
The average square footage of a new house in the US was 2,378 square feet in 2025, and the median was 2,142, according to Census Bureau data on new single-family homes. In 1973 the median was 1,525. Below, 53 years of new homes are rebuilt in 3D from the government's own numbers.
Scroll to move through the years
1973: one story, one car, and a coin flip on air conditioning
The typical new house of 1973 was a single story of about 1,525 square feet. Two out of three were built on one level, and another 10% were split-levels, a style that faded over the next three decades.
Only 49% came with central air. More than a third had no garage: 22% had no parking structure at all and 13% made do with a carport. Brick was the most common exterior, on 35% of new homes, and 41% sat on a full or partial basement.
1982: the smallest new homes of the era
Mortgage rates passed 18% in the fall of 1981, and builders answered with smaller houses. The median new home completed in 1982 had 1,520 square feet, the lowest figure in the 53 years of data.
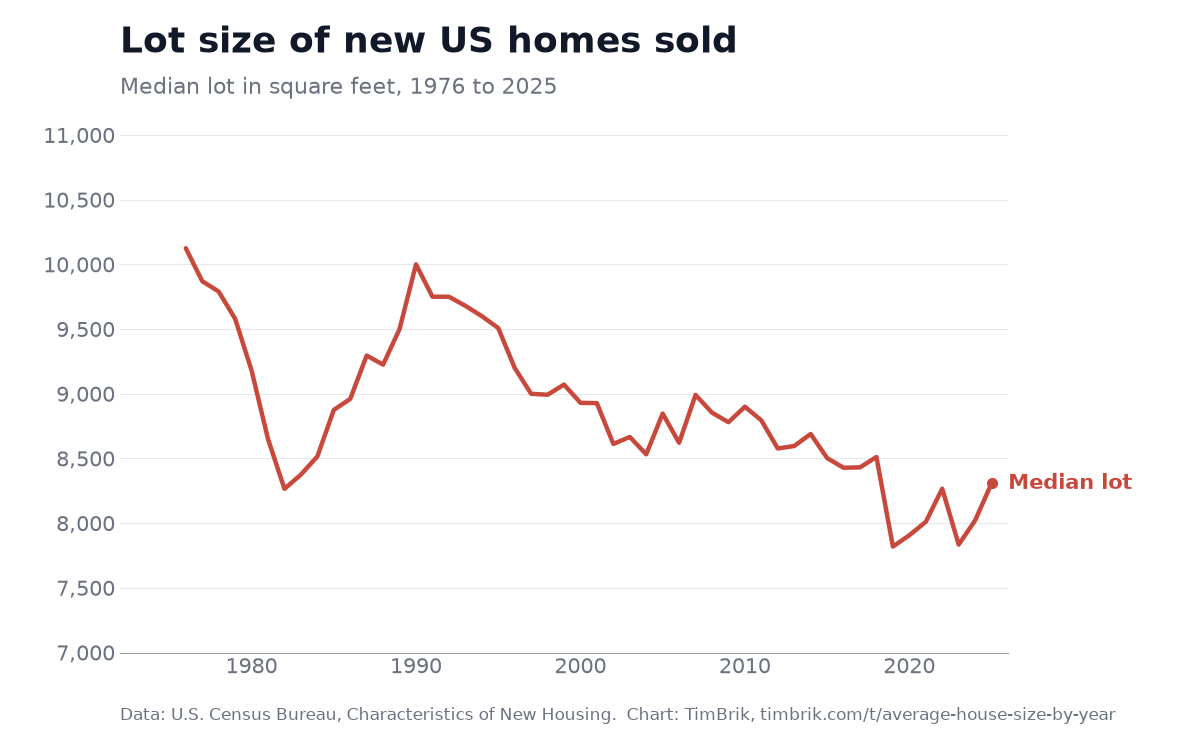
Completions fell to 632,000, about half the 1973 level. Almost one new home in four had two bedrooms or fewer. Lots were shrinking too: the median lot under a new home sold went from 10,125 square feet in 1976 to 8,265 in 1982.
1988: the second floor wins
In 1988, new homes with two or more stories outnumbered one-story homes for the first time, 49% to 46%. Building up gave buyers more room without a bigger lot.
By 1990 the median new home had 1,905 square feet, 25% more than in 1973, and 72% had a garage for two or more cars. Central air was in three out of four new homes.
2006: the boom year
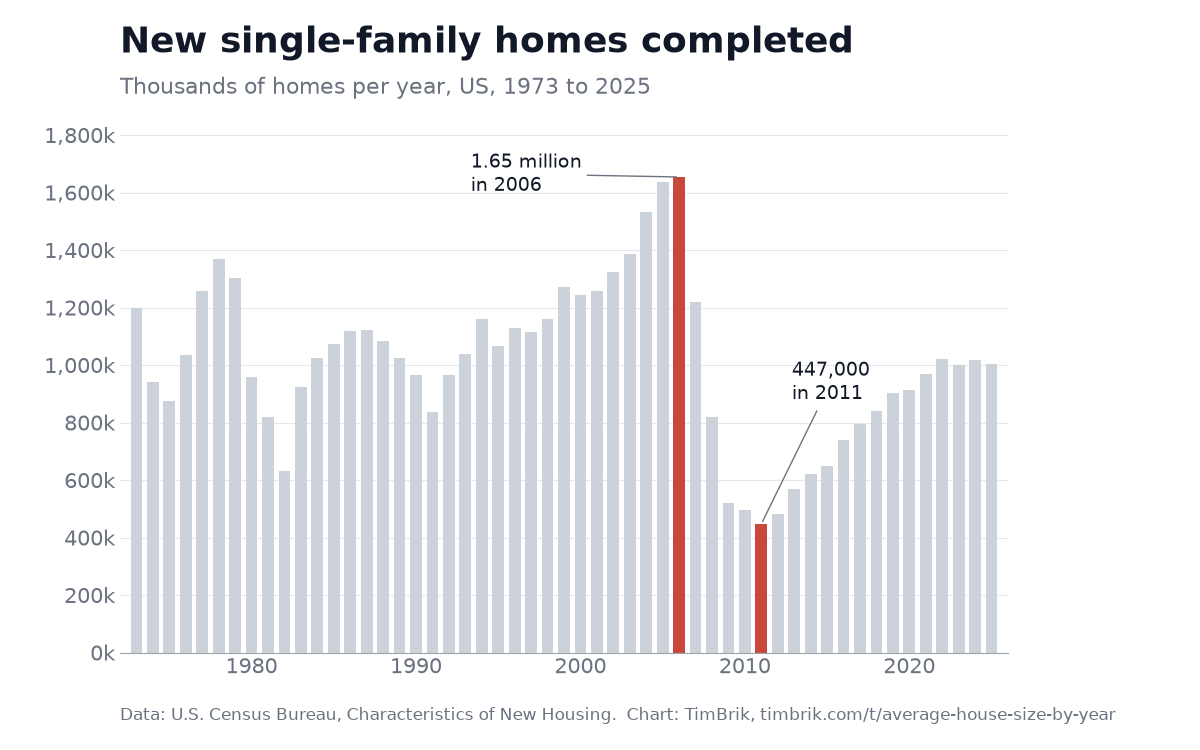
Builders finished 1.65 million new single-family homes in 2006, the highest number in the series. The median house reached 2,248 square feet. Three-car garages, which the survey started counting in 1992, were on 19% of new homes, and vinyl had become the most common siding, at 30%.
The median lot was 8,621 square feet. In 1976 a new home had 6.4 square feet of lot for every square foot of floor area. By 2006 it had 3.8.
2011: the crash, and the houses got bigger
Five years later, completions had fallen 73%, to 447,000, the lowest in the series. Watch the neighborhood empty out.
Yet the houses that did get built kept growing. Tight credit kept many first-time buyers out of the market, so builders built for the buyers who could still get a loan. The median new home went from 2,135 square feet in 2009 to 2,233 in 2011.
2015: peak house
The median new home hit 2,467 square feet in 2015, 62% larger than in 1973. The average was 2,687.
Nearly half of new homes, 47%, had four bedrooms or more. The share with three or more bathrooms, 38%, and the share with a garage for three or more cars, 24%, both peaked that year.
2022: the most expensive new homes on record
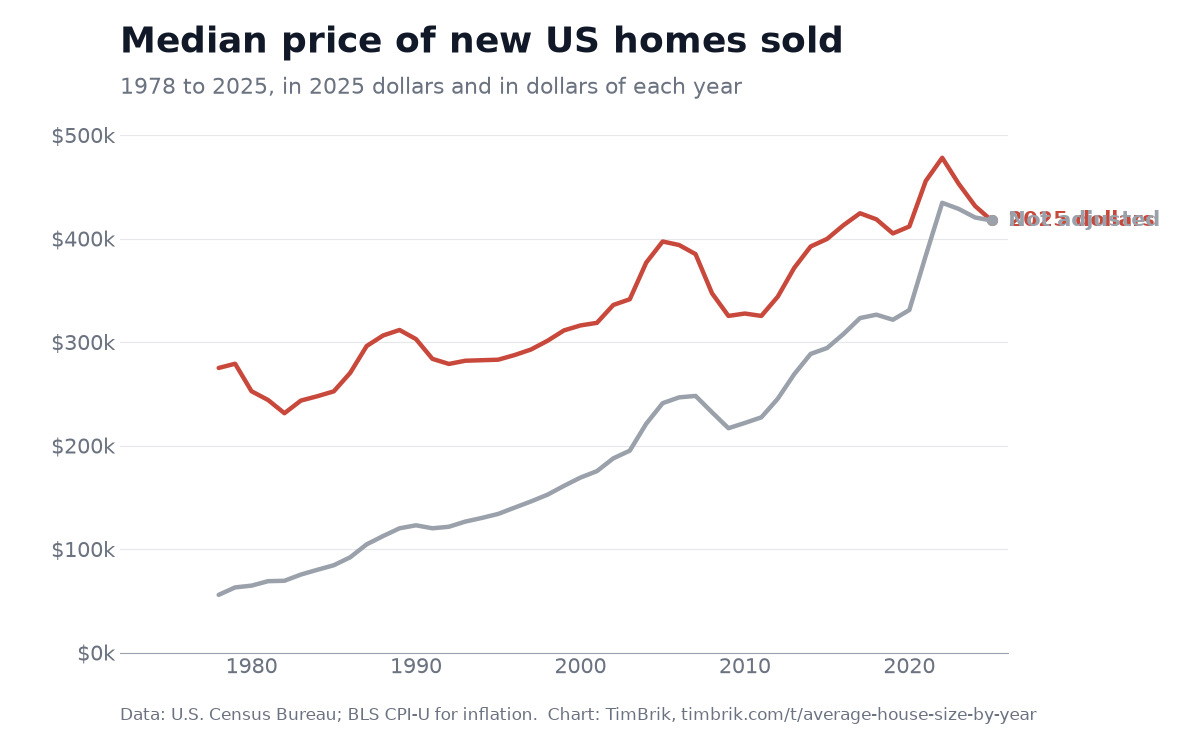
Adjusted to 2025 dollars, the median new home sold in 2022 cost $478,000, the highest since the price series began in 1978.
Per square foot, the median price was $172 in 2025 dollars, up from $120 in 1992, the first year the Census Bureau tracked it. By 2025 the median price had eased to $417,400, and the price per square foot to $155.
2025: smaller, on a slab, heated by electricity
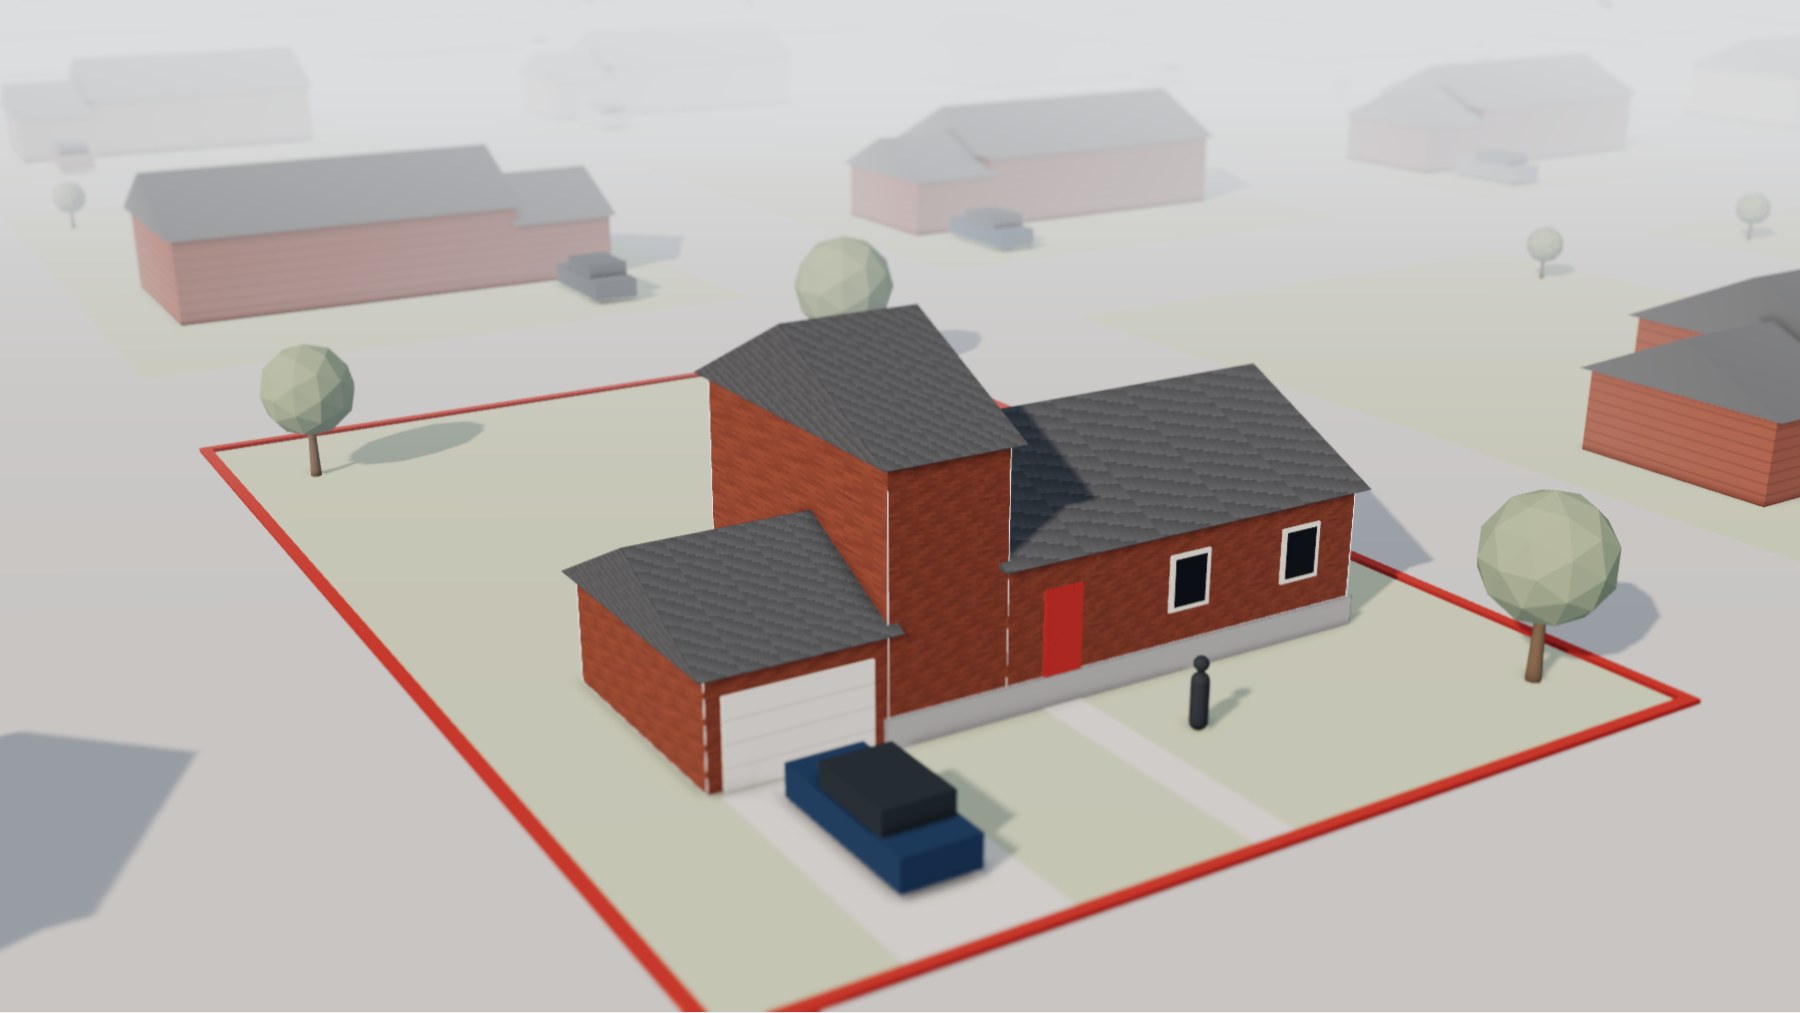
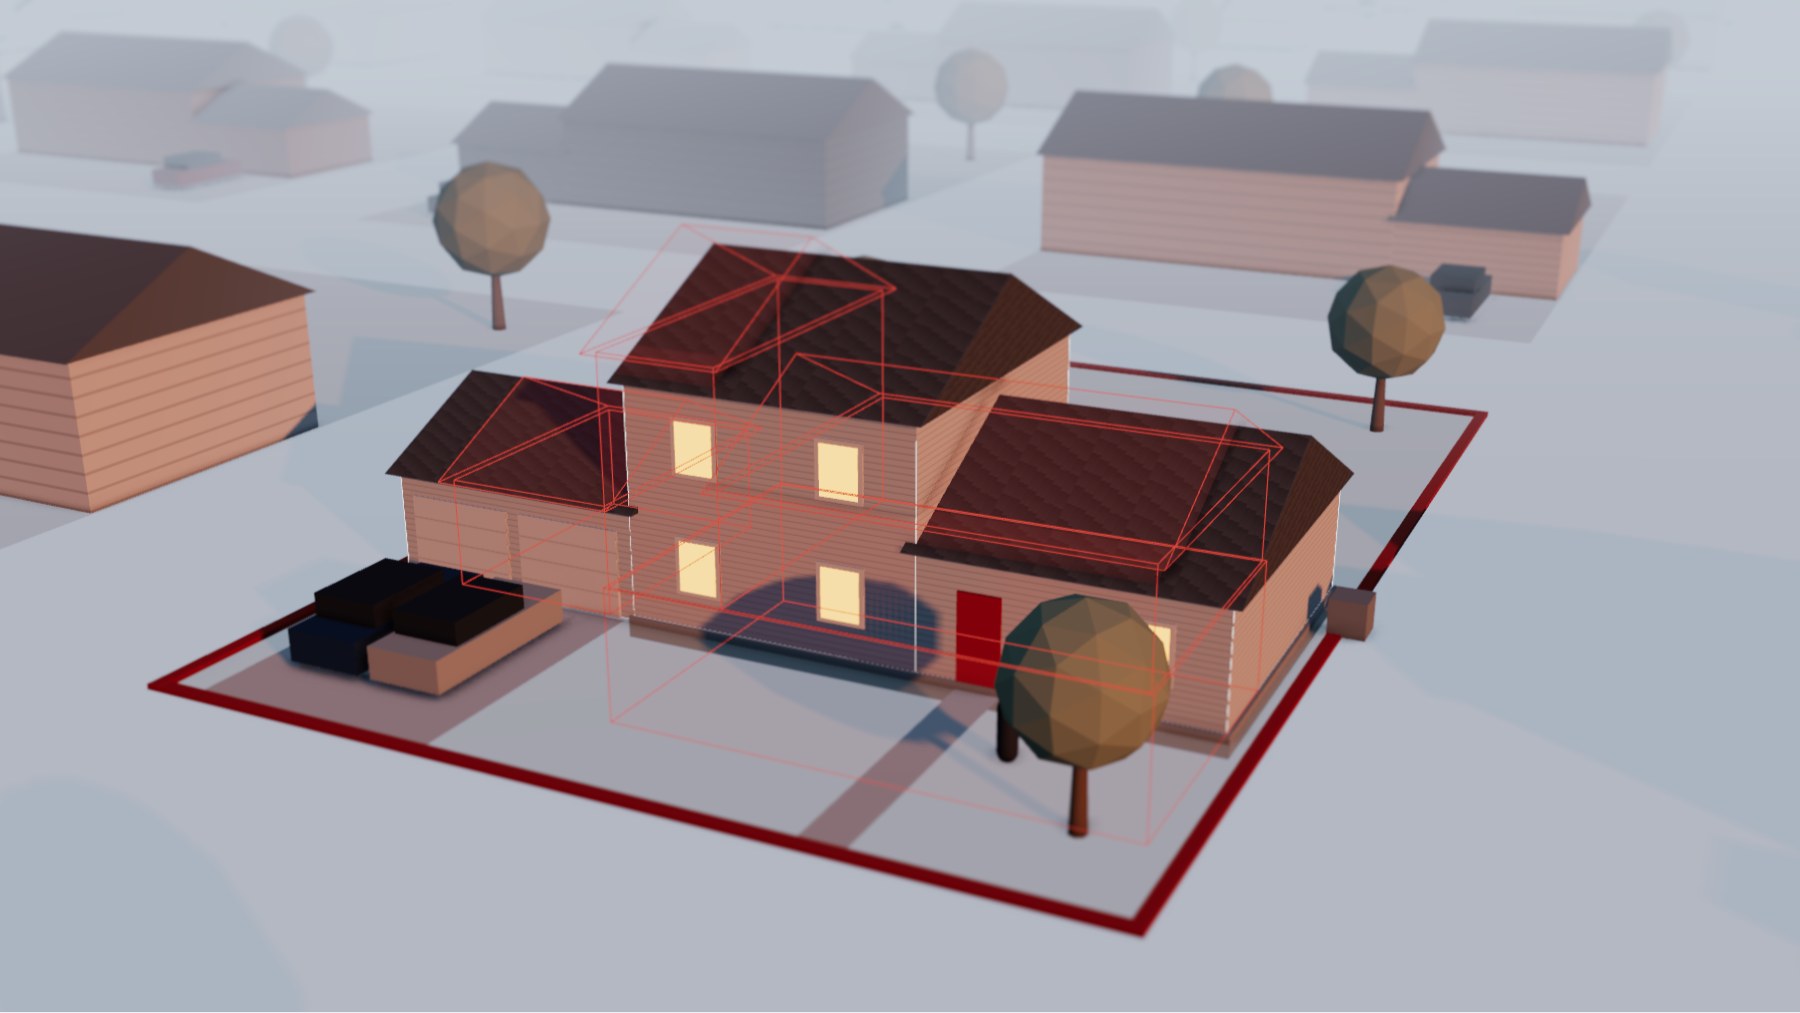
Since 2015 the median new home has shrunk 13%, to 2,142 square feet, about where it was in 2009. Higher prices and mortgage rates pushed builders toward smaller, cheaper plans. The red outline is the 1973 house, basement included.
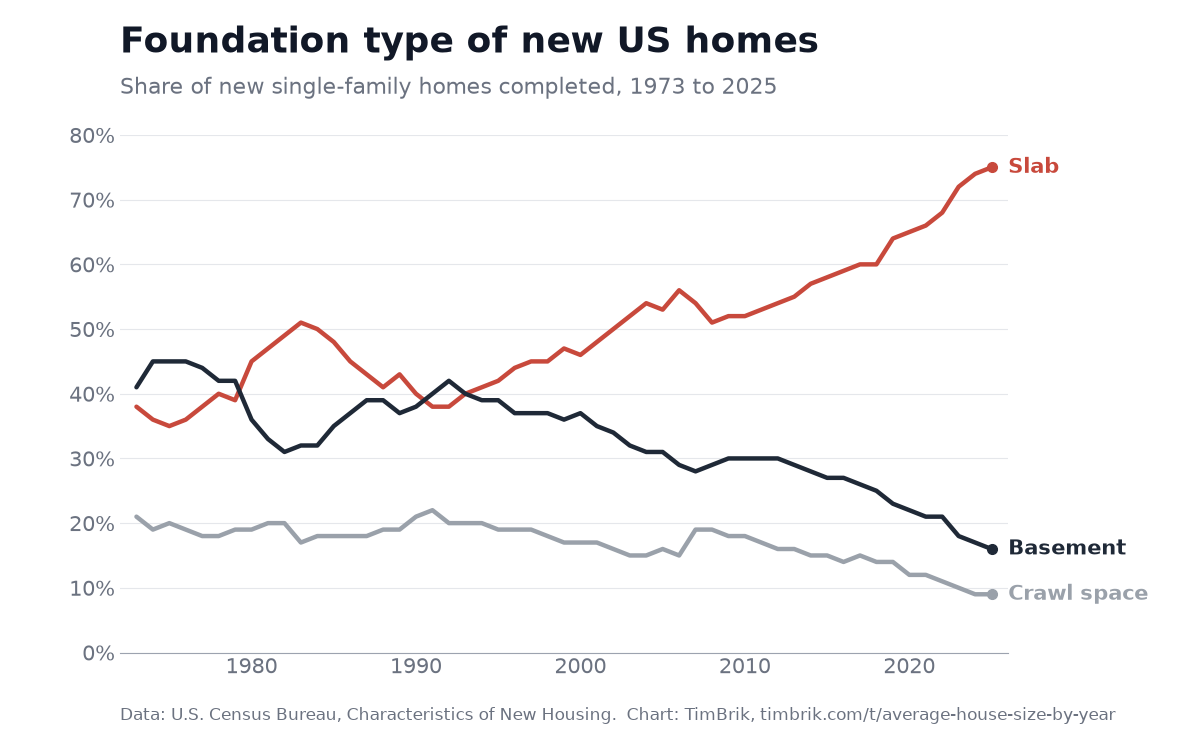
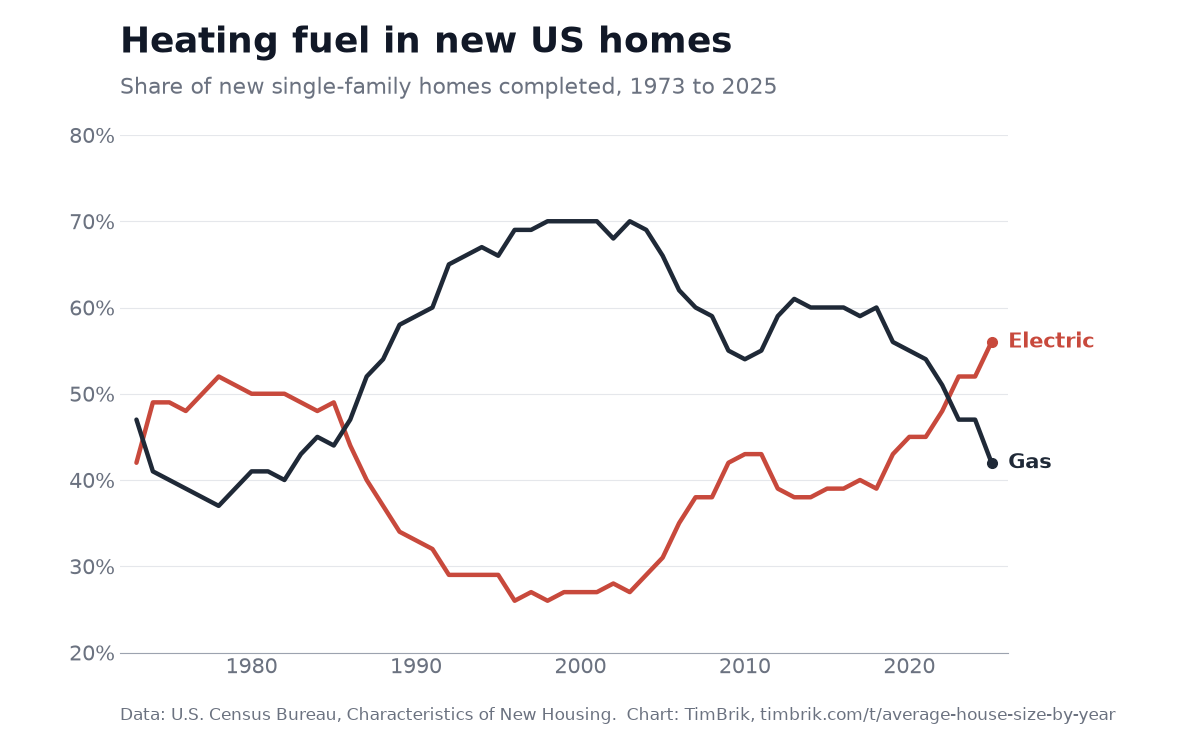
How houses are built changed too. 75% of new homes now sit on a slab, up from 38% in 1973, and only 16% have a basement. In 2023 electric heat passed gas for the first time since 1985, and in 2025 it was in 56% of new homes. Central air is in 98% of them.
When was your house built?
Pick a year to see the typical new home finished that year. The red outline is the typical new home of 2025. Use the buttons at the top to switch regions.
A typical new home finished in 1990 had 1,905 square feet, 237 square feet less than a new home in 2025. Its lot was 1,693 square feet larger.
See the numbers
| Feature | 1990 | 2025 |
|---|---|---|
| Median size | 1,905 sq ft | 2,142 sq ft |
| Median lot | 10,000 sq ft | 8,307 sq ft |
| 2+ stories | 49% | 51% |
| Central air | 76% | 98% |
| Garage for 2+ cars | 72% | 79% |
| Top foundation | Slab | Slab |
| Top siding | Wood | Vinyl |
| Median price, 2025 $ | $302,800 | $417,400 |
| Price per sq ft, 2025 $ | not tracked | $155 |
Key findings
- The median new home grew 62%, from 1,525 square feet in 1973 to 2,467 in 2015. By 2025 it was down 13%, to 2,142 square feet.
- Lots got smaller while houses got bigger. The median lot under a new home sold fell from 10,125 square feet in 1976 to 8,307 in 2025, with a low of 7,819 in 2019. Land per square foot of house dropped from 6.4 to 3.9 square feet.
- The basement is disappearing. 41% of new homes had a full or partial basement in 1973 and 16% did in 2025. Slab foundations went from 38% to 75%.
- Electric heat is back on top. It passed gas in 2023 for the first time since 1985, and reached 56% of new homes in 2025, against 42% for gas.
- Central air went from a coin flip to standard. 49% of new homes had it in 1973, and 98% did in 2025.
- The crash did not shrink the house. Completions fell 73% between 2006 and 2011, yet the median new home kept getting bigger until 2015.
- Prices outran size. After inflation, the median price of a new home sold rose 52% between 1978 and 2025, from $274,900 to $417,400 in 2025 dollars. The median floor area rose 29% over the same years. The real price per square foot peaked in 2022 at $172, against $120 in 1992.
- Regions build very differently. In 2025, 53% of new homes in the Northeast had a basement, against 4% in the South. Electric heat was in 73% of new Southern homes and 16% of new homes in the Northeast. The West had the smallest median lot, 5,969 square feet, and the Northeast the largest, 11,107.
The charts
Hover or tap a chart to read the value for any year. You are free to use these charts on your site. Each one has two embed codes, an interactive version and a plain image, and both include a credit link.
Size of new US single-family homes
Floor area in square feet, homes completed, 1973 to 2025
Lot size of new homes sold
Median lot in square feet, 1976 to 2025
New single-family homes completed
Thousands of homes per year, 1973 to 2025
Foundation type
Share of new homes completed, 1973 to 2025
Heating fuel
Share of new homes completed, 1973 to 2025
Median price of new homes sold
In 2025 dollars and not adjusted, 1978 to 2025
Press kit
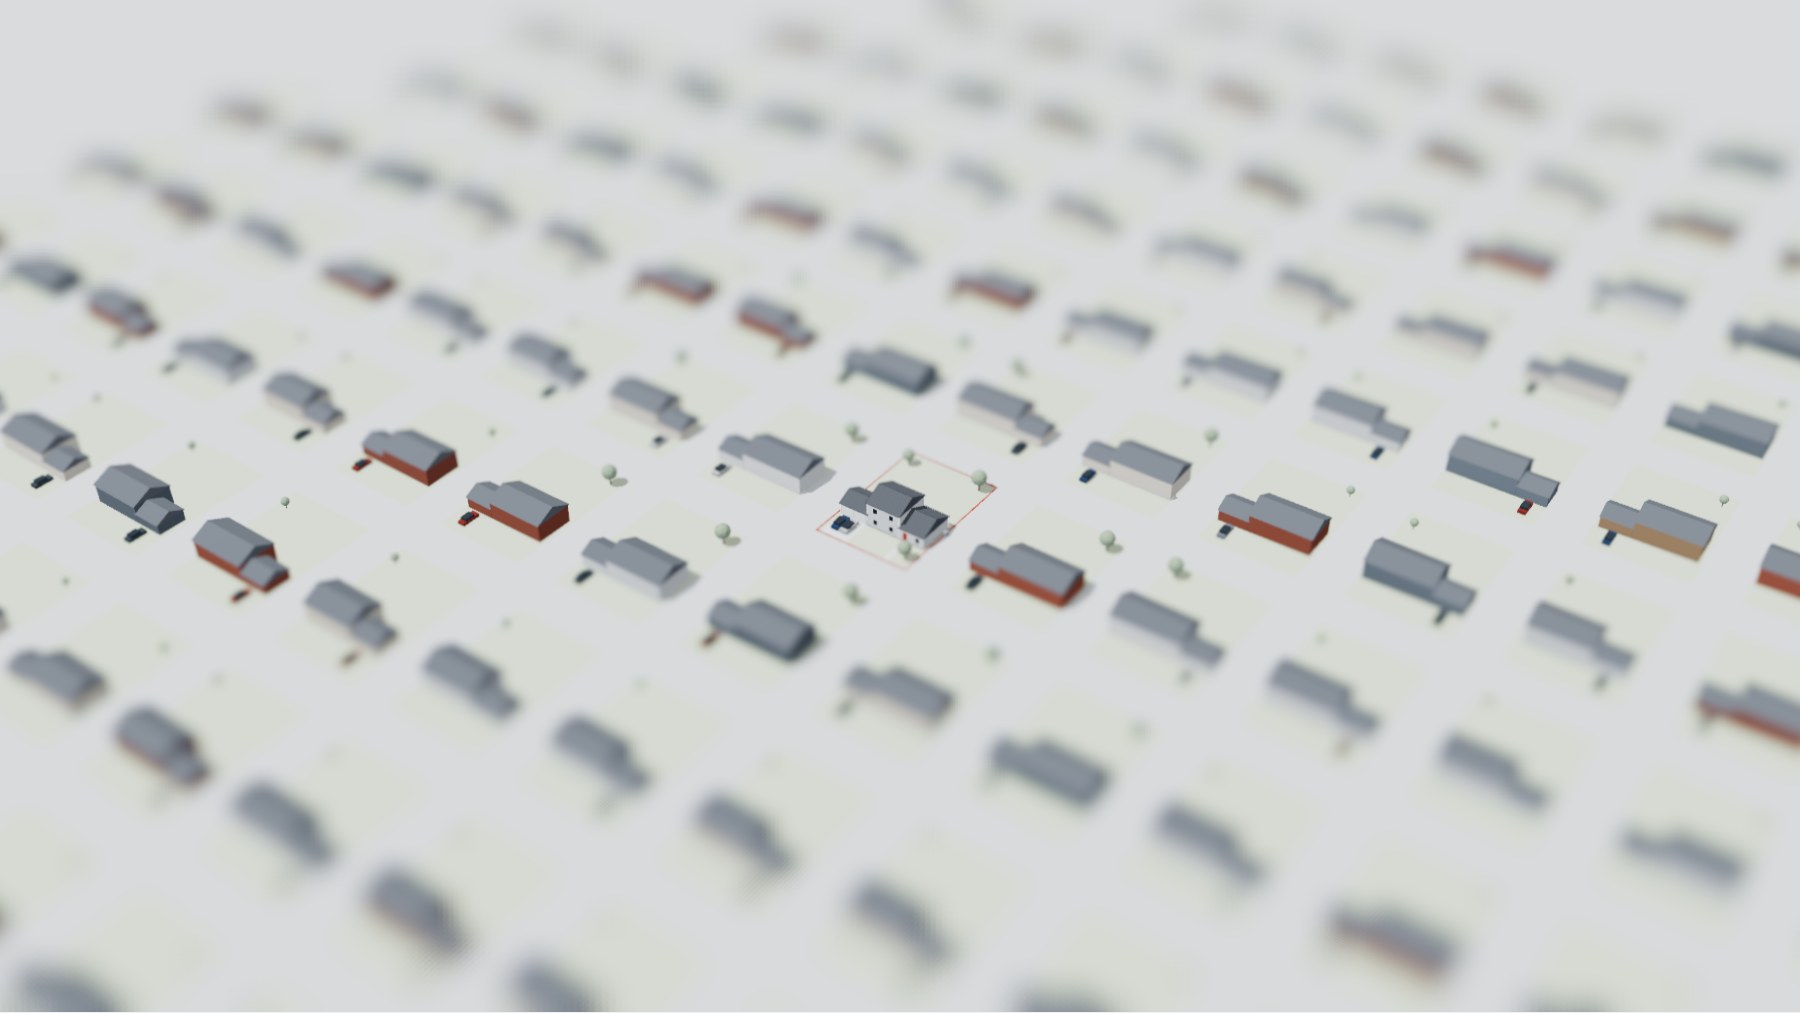
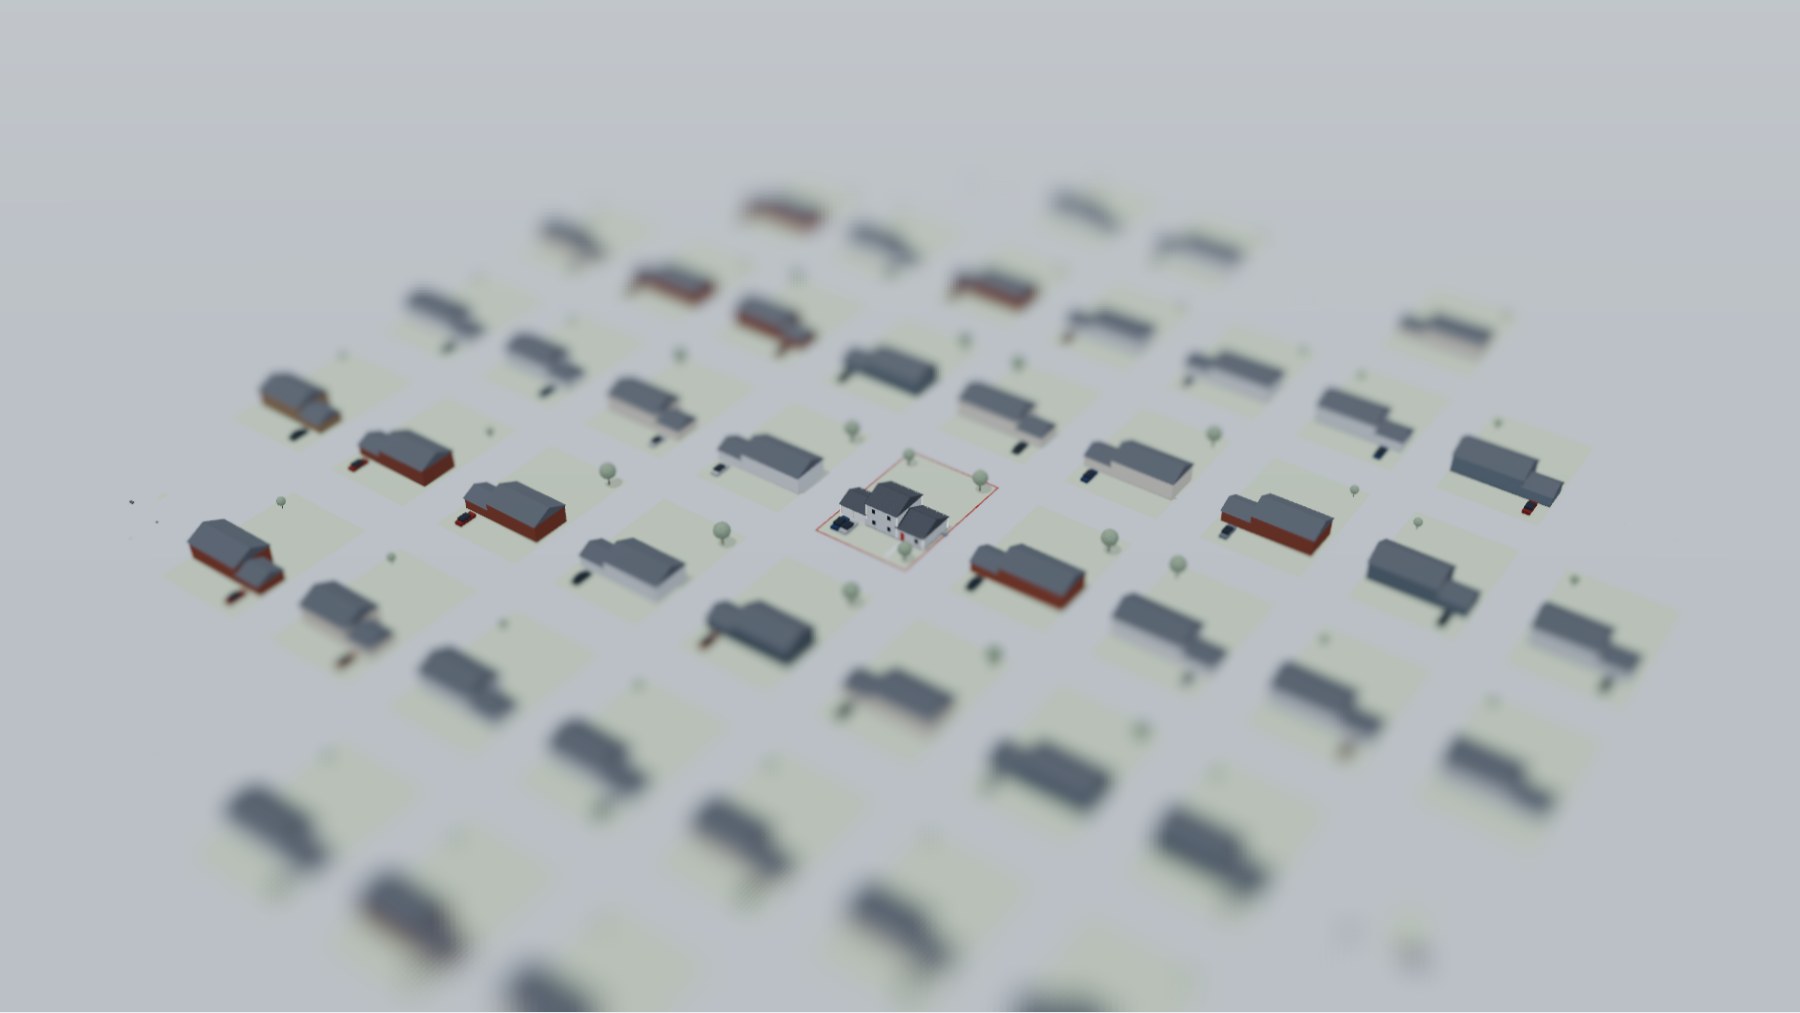
Renders from the 3D model, free to use with credit to TimBrik and a link to this page. Click an image to open the full-size file.
Download the data
The full table has one row per year from 1973 to 2025 and 33 measures: floor area, homes completed, stories, air conditioning, garages, bedrooms, bathrooms, foundation, exterior walls, heating fuel, lot size and price. Missing values mean the Census Bureau did not report that figure for that year.
The data and charts are free to use under a Creative Commons Attribution 4.0 license. Please credit TimBrik and link to this page:
TimBrik, "Average House Size by Year: How the New American Home Changed Since 1973," https://timbrik.com/t/average-house-size-by-year/, based on U.S. Census Bureau data.
How we built this
All house figures come from the Census Bureau's Survey of Construction, which samples new homes across the US every month. Floor area, homes completed, stories, air conditioning, garages, bedrooms, bathrooms, foundation, exterior walls and heating fuel describe new single-family homes completed each year. Floor area is the finished area of the house and does not include the garage.
Lot size and sales price are only reported for new homes sold, so those two series cover a slightly different group of houses. Lot size starts in 1976 and price in 1978. Prices were converted to 2025 dollars with the BLS consumer price index for all urban consumers. The 2025 average uses 11 months, because the October 2025 index was never published.
Story counts for 1973 to 2008 come from the Census Bureau's 2008 annual report, which listed split-levels as their own type. From 2009 the tables group homes into one story, two stories, and three or more. Garages for three or more cars were counted with two-car garages until 1992.
The 3D house is a schematic built from the numbers, not a drawing of a real plan. Floor area and lot size are to scale. The two-story section gets wider as the share of new homes with two or more stories grows, the garage width follows the average number of garage spaces, and the outdoor AC unit appears once most new homes have central air. Lots from 1973 to 1975 use the 1976 figure. Census figures are survey estimates and carry a margin of error.
The siding color and the foundation of the house follow the most common type in that year. The houses around the lot get siding in proportion to the Census shares, so a neighborhood in 1973 has about one brick house in three. The construction sequence at the start, the cars, trees, people and the time of day are decoration and carry no data.
The regional view uses the same Census tables for the Northeast, Midwest, South and West. Regional lot sizes and the price per square foot start in 1992, so the model uses the earliest regional value for earlier years. Price per square foot is the Census median for new homes sold, converted to 2025 dollars.
Sources
- U.S. Census Bureau, Survey of Construction, Characteristics of New Housing, annual tables, 2025 release
- U.S. Census Bureau, Characteristics of New Housing: 2008, tables "Number of Stories in New One-Family Houses Completed," United States and regions
- U.S. Bureau of Labor Statistics, Consumer Price Index for All Urban Consumers, U.S. city average, all items (series CUUR0000SA0)
- Freddie Mac, Primary Mortgage Market Survey, 30-year fixed rate history
Questions people ask
What is the average square footage of a house in the US?
New single-family homes completed in the US in 2025 had an average of 2,378 square feet of floor area and a median of 2,142 square feet. The median is the better guide to a typical house, because a small number of very large homes pulls the average up. These figures cover new construction. Older homes are smaller on average, so the typical existing house is below these numbers.
When were new American houses the biggest?
In 2015. The median new single-family home completed that year had 2,467 square feet and the average had 2,687. Both figures have fallen since.
Why are new homes getting smaller?
Higher home prices and mortgage rates pushed builders toward smaller, cheaper plans aimed at first-time buyers. The median new home went from 2,467 square feet in 2015 to 2,142 in 2025, a drop of 13%.
What is the average lot size for a new home?
The median lot for a new single-family home sold in 2025 was 8,307 square feet, about a fifth of an acre. The average was 14,699 square feet, pulled up by large rural lots. In 1976 the median was 10,125 square feet.
How many bedrooms does a typical new house have?
Three. In 2025, 46% of new single-family homes had three bedrooms, 42% had four or more, and 12% had two or fewer.
This page was made by TimBrik, a CRM for residential home builders that keeps leads, schedules and client updates in one place.