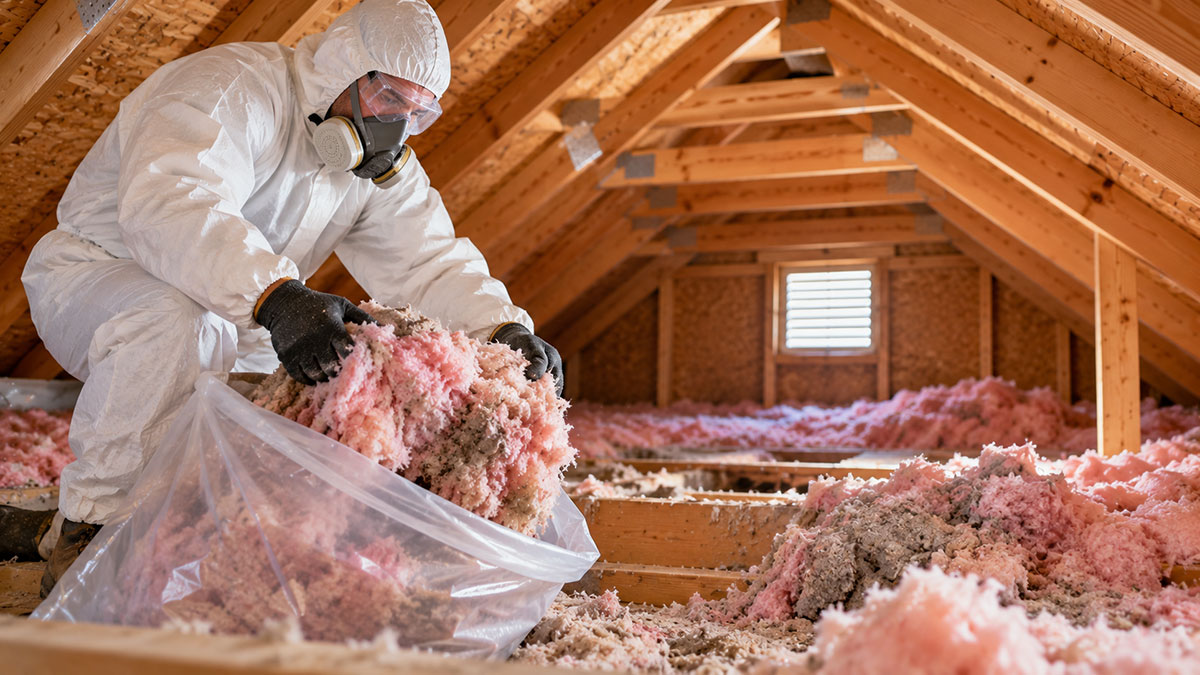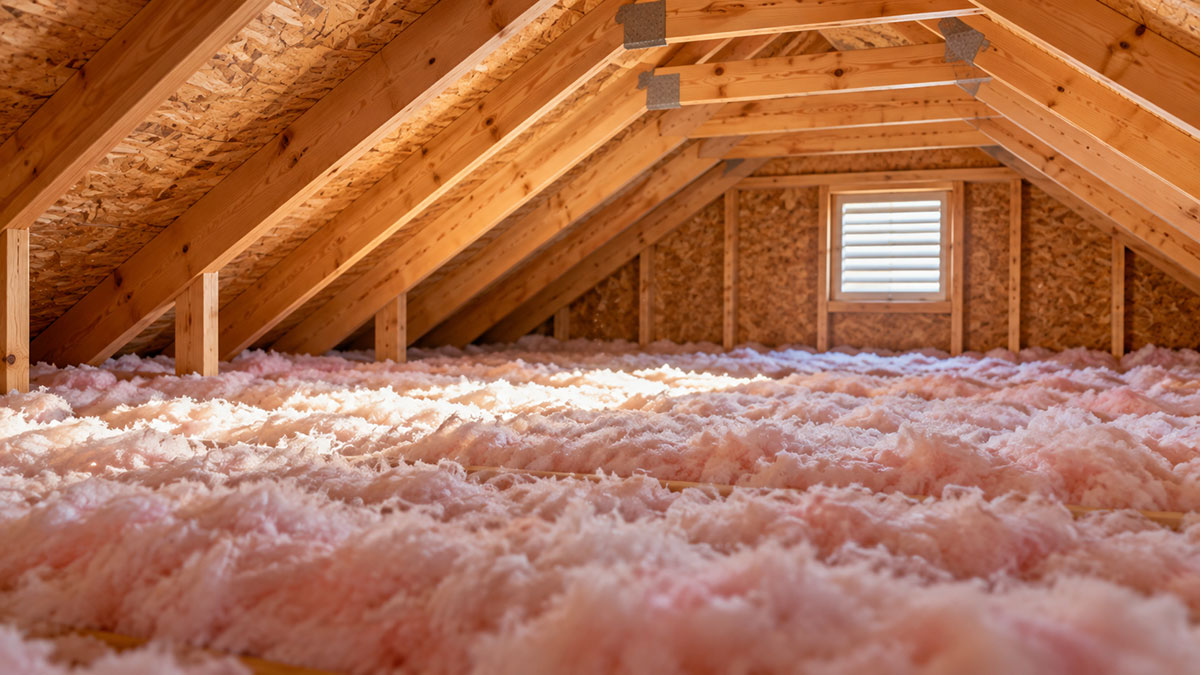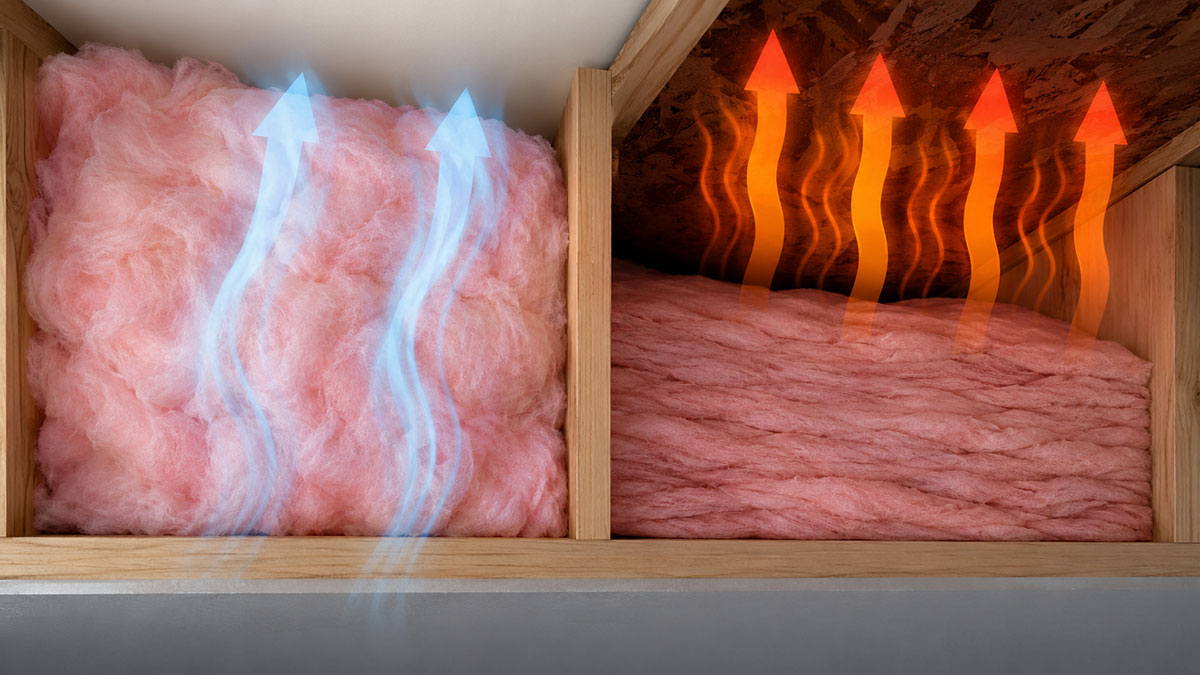
The R-value printed on a batt only holds at the thickness the batt was made to be. Squeeze it into a shallower cavity and you have compressed insulation, meaning fiberglass or mineral wool installed below its rated thickness. That raises R-value per inch while pulling the batt’s total R-value under what the label says.
Builders and HERS raters run into this wherever a framing cavity is shallower than the batt. Model energy codes don’t judge it by the number on the bag either. They use an adjusted R-value table.
Manufacturers have noticed the problem. Owens Corning’s compressed R-value technical bulletin, updated in September 2024, lists dedicated C-grade batts such as R-30C and R-38C, engineered specifically for compression into shallower rafter and joist cavities.
What Is Compressed Insulation?
Fiberglass and mineral wool batts, and loose-fill products too, count as compressed once they end up thinner than their rated thickness.
The term shows up most often around standard batt insulation, since batts come pre-sized to a cavity depth and lose that fit the moment a stud bay runs shallow.
The obvious cause is a stud or joist cavity shallower than the batt’s labeled thickness. Material jammed behind wiring or boxes gets compressed locally too. Loose-fill insulation is the odd one out, because it settles under its own weight and compresses on its own schedule, no matter how careful the installer was on day one.
NAIMA, the trade association for fiberglass and mineral wool manufacturers, doesn’t see compression as a defect. It counts as a normal installation condition, provided the compressed R-value is calculated correctly.
How Does Compression Change R-Value and Density?

Pushing the same fiber into less space moves R-value per inch up and total R-value down. Both happen at once, which trips people up.
R-Value Per Inch Versus Total R-Value
Packing fiber tighter changes how heat moves through the material. That’s why R-value per inch climbs as a batt gets thinner even while the total drops.
Take a 6.25 inch R-19 batt compressed to 5.5 inches. It gains R-value per inch but loses total R-value. Where compression starts doing more harm than good depends on the product.
Even Energy Vanguard, a building science firm, had to publicly correct its own earlier advice on this point after readers pushed back. That says something about how counterintuitive the tradeoff is.
Density Increase From Compression
Density rises as thickness drops, and that relationship is what actually governs thermal conductivity inside the compressed material.
Gaps do more damage than density does.
NAIMA’s own technical staff point to incomplete cavity fill as the bigger performance problem, well ahead of compression itself. A batt compressed evenly across its full width still performs close to its adjusted rating. One with voids or a loose section sitting in the same cavity doesn’t.
Which Standards Measure the R-Value of Compressed Insulation?
Compressed R-value gets tested and reported under a handful of ASTM standards.
| Standard | What It Tests | Applies To |
|---|---|---|
| ASTM C518 | Steady-state R-value via heat flow meter | Batt, board, and loose-fill products |
| ASTM C687 | Thermal resistance at varying densities | Loose-fill insulation specifically |
| ASTM C177 | Guarded hot plate reference method | Calibration baseline for C518 |
Independent, accredited labs such as Intertek run these tests, and code-evaluation bodies such as ICC Evaluation Service (ICC-ES) review the data to certify that a manufacturer’s published R-values meet code requirements.
None of these standards test a batt at a single thickness only. Manufacturers submit samples at multiple compressed thicknesses, so the resulting chart shows R-value across a range of cavity depths and not just the labeled one.
How Much R-Value Is Lost by Wall Cavity Depth?
Owens Corning’s own technical bulletin, updated in September 2024, confirms a standard R-19 batt drops to R-18 once it’s compressed into a 2×6 cavity.
That’s a full R-point lost from squeezing 6.25 inches of material into a 5.5 inch space. Deeper compression costs more per inch, so the loss speeds up.
| Cavity | Depth | Batt Label | Compressed R-Value |
|---|---|---|---|
| 2×4 | 3.5 in | R-13 | R-13 (no compression) |
| 2×6 | 5.5 in | R-19 | R-18 |
| 2×4 (deep pack) | 4 in | R-19 | R-14 |
The last row is the ugly one. NAIMA’s compression data shows that forcing a batt built for a much deeper cavity into a shallow one loses far more than a fraction of an inch would suggest.
That’s what insulation compression charts exist to quantify, since depth and R-value don’t have a linear relationship.
Cavity depth also matters more for standard fiberglass insulation than for denser batt products, since standard-density fiberglass carries more excess loft to begin with.
Fiberglass, Mineral Wool and Cellulose Under Compression
These materials don’t respond to a shallow cavity in the same way.
Fiberglass Batt
Most compression charts are built around standard fiberglass batt, and it’s also the most forgiving of moderate compression.
Standard density fiberglass compresses easily and recovers most of its loft once released. High-density fiberglass packs more fiber into the same thickness, so a shallow cavity asks less of it.
Owens Corning and CertainTeed both sell high-density R-21 fiberglass batts built at 5.5 inches specifically so a 2×6 wall never has to compress a standard R-19 to fit.
Mineral Wool Batt
Mineral wool holds its shape under pressure better than fiberglass.
Johns Manville’s TempControl rock wool insulation ships as a dense, semi-rigid batt rather than a loose fiberglass roll, which changes how it behaves in a tight cavity.
Rockwool’s ComfortBatt line reaches R-23 at the same 5.5 inch depth where fiberglass tops out around R-21, a direct result of that higher base density.
Cellulose Loose-Fill
Cellulose insulation is a different story. A cavity doesn’t compress it. Gravity and time do, and it settles gradually inside closed attic and wall spaces.
Dense-pack installs compress it on purpose to limit later settling. Open blown attic cellulose just settles on its own over several years, losing R-value gradually.
ASTM C687 governs how that settled or packed density gets tested, since loose-fill thermal resistance depends on installed density rather than a single fixed thickness.
Does Compressed Insulation Meet Building Code?
It can, as long as the compressed R-value gets documented and not the label R-value.
Model energy codes are specific about where the line sits. The threshold is 85 percent of rated thickness. Insulation compressed to that point or below is treated as compressed insulation under the code and has to use an adjusted R-value table instead of the batt’s printed number.
The Florida Building Code’s Energy Conservation volume states this directly in Section R303.2.1.1. Seattle’s Energy Code gets to the same place through its Appendix A101.4, which points to the ASHRAE Fundamentals Handbook for the calculation.
California’s Title 24 energy code works on the same principle. What counts toward compliance is what’s installed, not what’s printed on the bag.
NAIMA’s own guidance document for HERS raters says a compressed batt given the correct compressed R-value can still qualify as a Grade 1 installation under RESNET’s grading criteria. Grading it down for compression alone would penalize the same performance loss twice.
ENERGY STAR insulation guidance starts from a different assumption, that installers deliver full rated thickness and not a compressed approximation of it.
Standard Batt Versus High-Density Batt for a Tight Cavity
A 2×6 wall is the classic case where this decision actually matters.
A standard R-19 batt is 6.25 inches thick and will compress. A high-density R-21 batt is built at 5.5 inches and won’t.
The standard batt costs less per square foot in most market comparisons. Once it’s squeezed into a 5.5 inch cavity it loses R-value against its printed R-19, a full point according to the Owens Corning bulletin above, and it needs careful, even compression to avoid gaps around wiring and boxes.
The high-density batt delivers its full printed R-value with no compression at all. It costs more per square foot, but the denser fiber holds its shape, which makes it easier to split cleanly around wiring.
Whether the difference in cost per square foot for insulation outweighs a guaranteed R-value depends on the specific bid. The tradeoff itself is the same across brands.
Owens Corning, CertainTeed, and Knauf each sell a high-density option sized for standard 2×6 framing, so availability is rarely what decides it. On a 2×6 wall I’d pay the extra and skip the argument.
How to Install Batt Insulation Without Compressing It
Most unwanted compression comes down to sequence, not skill. Measure the cavity before buying material, not after the batt is already in your hands.
- Measure the actual depth of each stud or joist bay, since framing varies slightly even on the same wall.
- Match the batt’s labeled thickness to that measurement, or size up to a high-density product if the bay runs shallow.
- Cut each batt to the precise length of its own bay instead of stretching one long roll across several.
- Split the batt around plumbing and any wiring or electrical boxes rather than packing the whole thickness behind them.
- Fluff the cut edges before placing the batt so the fibers loft back out to their rated thickness.
Splitting beats stuffing. A batt divided into two thin layers around an obstruction keeps more of its rated R-value than one thick layer crammed against it.
Bruce Harley, an energy efficiency expert featured in the Journal of Light Construction, has pointed out that most fiberglass installation problems trace back to cutting and fitting, not to the material itself.
The step-by-step process in our guide to installing fiberglass insulation covers the same sequence in more depth, bay by bay.
For odd angles and partial bays, how to cut fiberglass insulation explains clean cuts that avoid the ragged edges that cause gaps.
How to Calculate the R-Value of Already Compressed Insulation
Compressed R-value follows a formula, so nobody has to guess.
NAIMA publishes the calculation manufacturers and HERS raters use to convert label R-value into compressed R-value based on installed thickness. In practice, a 3.5 inch R-13 batt compressed into a 2.5 inch cavity drops to R-10, per NAIMA’s compression data.
On the testing side, ASTM C518 runs at a mean temperature of 75 F, within an allowed range of 35 F to 110 F, per Intertek’s documentation of the standard. ASTM C687 covers loose-fill testing across mean temperatures from -4 F to 131 F, since loose-fill density varies more than batt density.
Field verification is a separate step from the math, and nobody wants to do it after the drywall is up.
A thermal imaging camera can locate compressed or gapped sections before a wall gets closed up, since compressed fiberglass shows up as a colder patch relative to the surrounding cavity.
Some contractors fold this check into a broader home energy audit, comparing calculated compressed R-values against what the imaging actually shows.
When Compressed Insulation Stops Performing
Compression has limits, and past a certain point the math stops being forgiving.
The word gets stretched to cover several different problems, and they don’t behave the same way.
| Failure Mode | Cause | Fix |
|---|---|---|
| Over-compression | Batt forced far below its rated thickness | Swap to a thinner high-density product |
| Incomplete fill | Gaps or voids left around the compressed batt | Re-cut and re-fit the section, no shortcuts |
| Loose-fill settling | Material compresses under its own weight over years | Top off to the labeled settled thickness |
The last row is a genuinely different problem from wall-cavity compression, and federal rules treat it that way.
The FTC’s R-Value Rule (16 CFR 460.12) requires loose-fill insulation packaging to disclose both the minimum settled thickness and the initial installed thickness, because insulation settlement changes the coverage math after installation.
Greenfiber, the largest manufacturer of cellulose insulation in North America, is one of the producers whose loose-fill products fall under that federal settled-thickness disclosure rule.
None of this applies to every material.
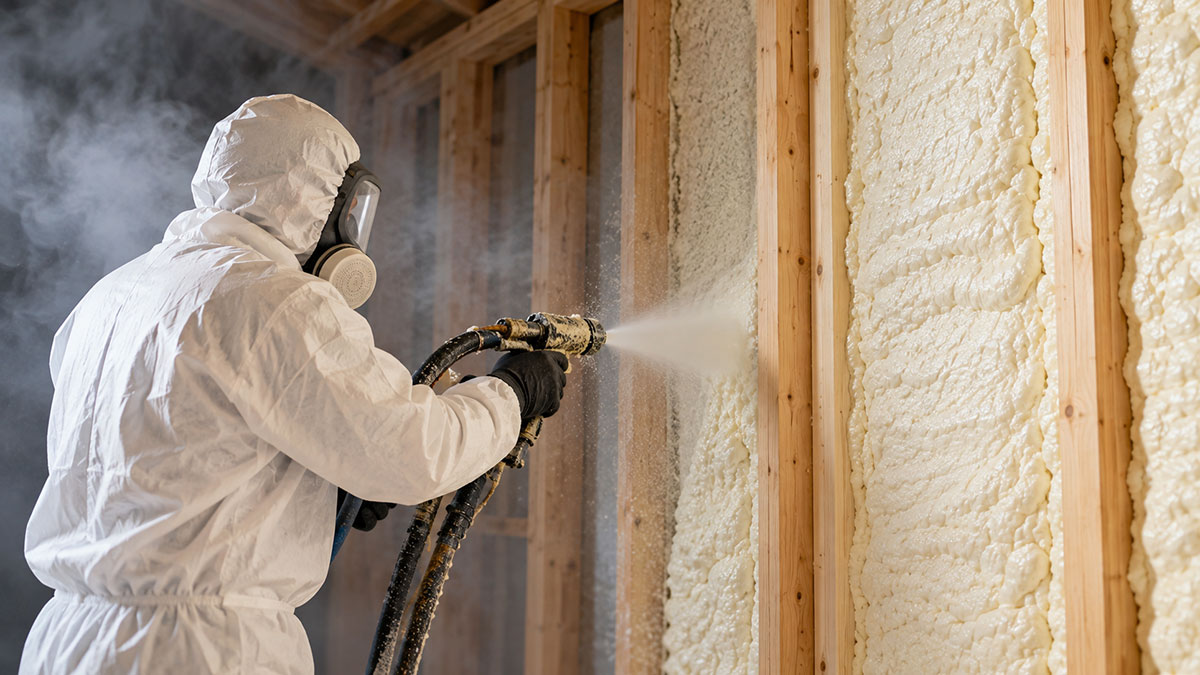
Spray foam insulation cures into a rigid or semi-rigid structure and isn’t installed at a compressible thickness the way batt or loose-fill products are. Once it sets, there’s no cavity depth calculation to run and no compression chart to check.
FAQ on Compressed Insulation
Is compressed insulation the same as insulation compressed for shipping?
No. Shipping compression uses machinery to pack a roll of fiberglass or mineral wool tightly for transport, and the material re-lofts once it’s unpackaged.
Compressed insulation means a batt or loose-fill product held below its rated thickness inside a wall cavity or attic.
Do spray foam and rigid foam board insulation get compressed the same way batts do?
No. Spray foam insulation cures into a rigid or semi-rigid structure at a fixed thickness, and rigid foam board insulation ships at its finished dimension.
Neither one compresses into a cavity the way fiberglass batt or loose-fill insulation does.
Does compressing fiberglass permanently damage it?
Standard fiberglass batt recovers most of its loft once released from moderate compression, since the fibers are resilient and not crushed.
Repeated or extreme compression over years, or storage under heavy loads, reduces how fully the batt springs back to its labeled thickness.
Does compression reduce the soundproofing performance of insulation?
The higher density from compression improves sound absorption slightly, since denser fiber resists vibration transfer better than loose material.
The effect is small next to acoustic-rated products such as mineral wool batt, which people choose specifically for soundproof insulation performance.
Does the FTC R-value rule apply to compressed insulation labeling?
The FTC R-Value Rule (16 CFR Part 460) governs how manufacturers disclose R-value, thickness, and density on every insulation label.
It has no separate compressed insulation clause, so compressed batt performance gets documented through manufacturer compression charts instead.
What Should You Check First With Compressed Insulation?
Start with thickness. Measure what’s actually installed and compare it to the batt’s own label, since everything else, from R-value per inch to code compliance, depends on that number being right.
After that, compare the ratio against the code’s compression threshold, and pull the manufacturer’s compression chart if a question is still open.
A standard R-19 batt compressed into a 2×6 cavity sits at 88 percent of its rated thickness. That’s above the 85 percent line that triggers a code adjustment, yet it still loses a full R-point in practice.
Compliance and thermal performance move on separate tracks, so a batt can clear the code check and still underperform its label.
That gap matters most where insulation gets disturbed again, during a remodel or an addition, which is where a plan to improve home insulation picks up.